Each year, the City of Weatherford publishes a report on its drinking water. Here is a plain-English look at the results homeowners ask about most. For every result, see the city’s full 2024 report.
Where the water comes from
The city provides surface water from Lake Weatherford in Parker County, with Benbrook Lake in Tarrant County as a secondary source.
Hardness: 178 ppm
That is about 10 grains per gallon, near the top of the hard range. It is the main reason for scale, spots and wear on water-using appliances. A water softener is the usual fix.
Total dissolved solids: 305 ppm
TDS measures the minerals, salts and metals dissolved in water. Weatherford’s result is well below the 1,000 ppm limit listed in the report. A reverse osmosis system can reduce TDS further in drinking water if you prefer.
Chloramine: 3.23 ppm average
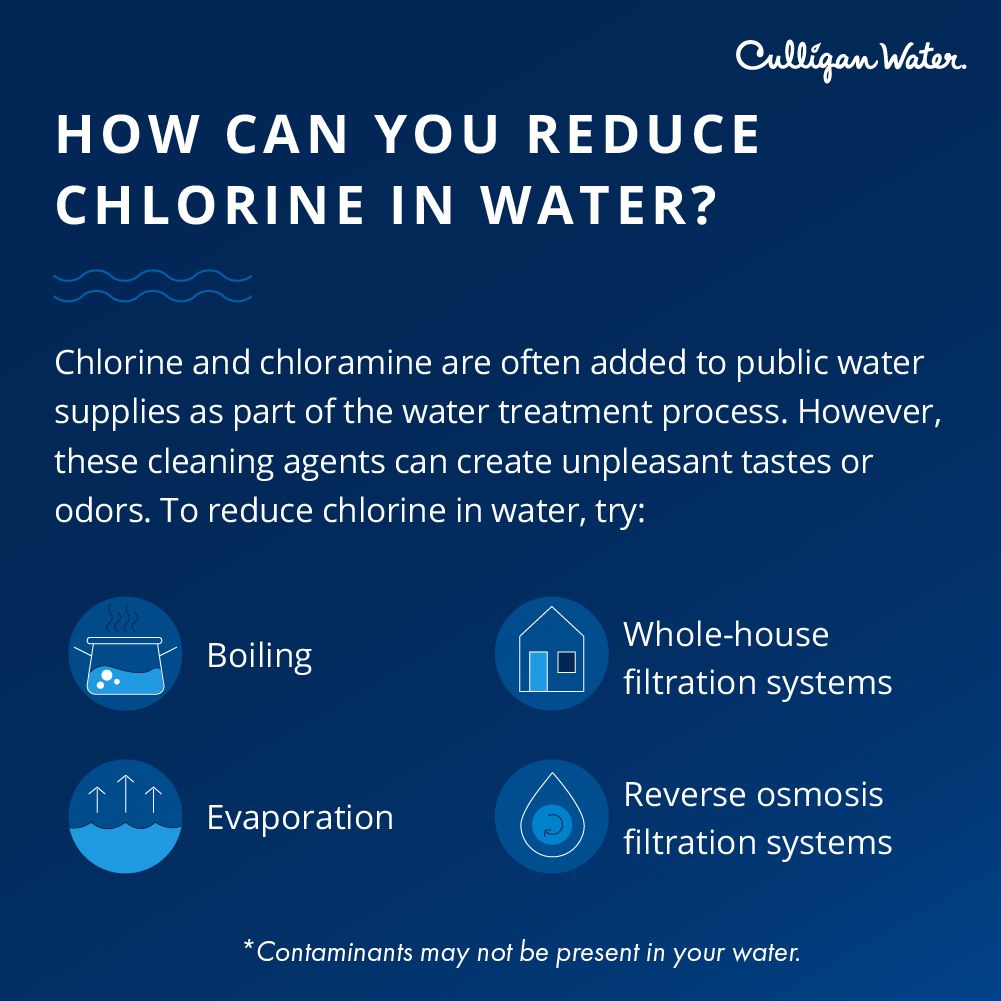
Chloramine is the disinfectant the city uses to keep water safe as it moves through the system. The 2024 average was under the 4 ppm limit. Some people notice its taste or smell, and filtration designed for chloramine can reduce it.
Lead and copper
In the most recent sampling listed (2022), the 90th percentile lead result was 1.4 parts per billion against an action level of 15, and copper was 0.089 ppm against an action level of 1.3, with no sites over either level. These metals usually come from household plumbing, so results can differ from home to home.
PFAS
Under the EPA’s fifth Unregulated Contaminant Monitoring Rule, the report lists two PFAS at very low levels: PFPeA at 0.004 ppb and PFBA at 0.005 ppb. The report notes these results are for information only and that PFAS limits take effect in 2029.
Your tap is what matters
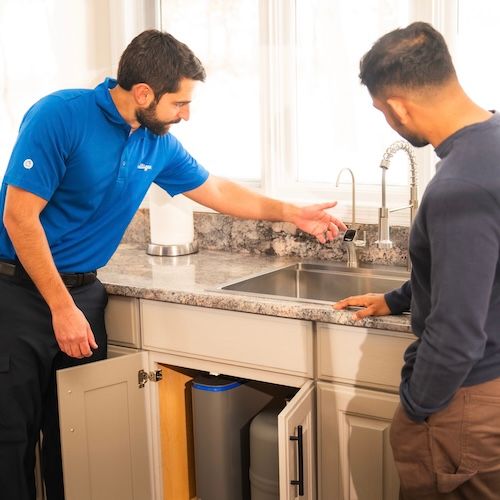
A city report describes the public water system, not the water at your faucet, and it does not cover private wells. Culligan of Weatherford can test your water at your home for free. Schedule your free water consultation.